Spectral Flow Analysis (SFA) - Life Sciences Cloud Platform

The SFA - Life Sciences Cloud Platform is a cloud-based solution that can efficiently perform a wide array of analysis protocols, ranging from conventional analysis including gating, in which only specific cell populations are selected for analysis and quantification based on differences in scattered light and fluorescence signal intensity, to advanced analysis such as dimensionality reduction, which enables a two-dimensional view of multi- dimensional information, and clustering, which automatically classifies cell populations.
The solution is compatible with Sony’s flagship ID7000™ Spectral Cell Analyzer. The raw data output and analysis results from the ID7000 software can be directly imported and analyzed without any conversion. In addition, this solution features BL-FlowSOM, a newly developed algorithm that speeds up FlowSOM, one of the clustering methods.
Furthermore, because each algorithm is pre-installed in the cloud environment, immediate analysis is possible, andresults from the data analysis can be managed and shared among users. A special license needs to be purchased to use Spectral Flow Analysis.

Many of the analysis functions including the following that are available in the ID7000 software can also be used in Spectral Flow Analysis.
- Fluorescence compensation (unmixing) algorithm – weighted least squares method (WLSM)
- Unmixing Viewer
- Autofluorescence finder
- Preset Fluorochromes
- Preference settings
BL-FlowSOM Function
BL-FlowSOM is a clustering function to group data according to the degree of similarity between the data. It speeds up FlowSOM, which is widely used for flow cytometry analysis (see the following paper for the details), by using a newly developed algorithm.
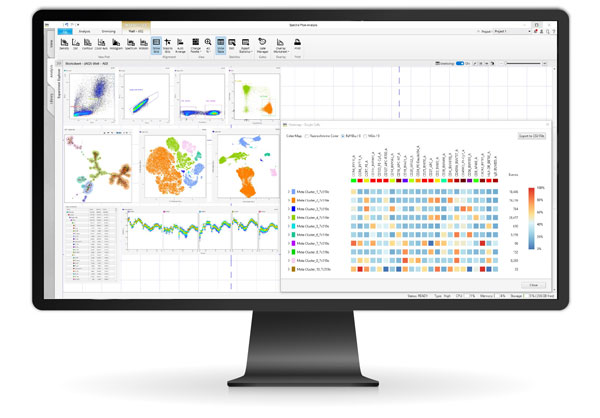
With the BL-FlowSOM function, you can select the star, population pie, and median marker value graph modes. In addition, the expression level of each marker of extracted clusters can be visualized on a heatmap.
Dimensionality Reduction Function
Dimensionality reduction is a function to “compress” multi-dimensional cell data to display it on a two-dimensional plot by converting to low-dimensional data while preserving as much of the important information about the multi-dimensional data structure as possible.
The Spectral Flow Analysis software employs two techniques: “UMAP” and “FIt-SNE.”
- UMAP: Uniform manifold approximation and projection (UMAP) is a technique whereby the points that are close to an original feature space are compressed again after they have been compressed so as to make them closer. For details on the algorithms, see the following paper. With UMAP, you can select a density plot and dot plot.
- FIt-SNE: FFT-accelerated interpolation-based t-SNE (FIt-SNE) compresses the points that are close to an original feature space again after they have been compressed so as to make them closer just like with UMAP, but the “closeness” is represented by probability distribution. FIt-SNE is a technique to speed up t-Stochastic Neighborhood Embedding (t- SNE) by using FFT and other means. For details on the algorithms, see the following paper.
Ensuring objectivity through use of data cleaning algorithms
Various algorithms (flowAI, flowCut, flowClean, PeacoQC (Peak-based selection of high quality cytometry data)) can be used to automatically detect and remove noise in the data generated by turbulence that can occur during data acquisition. Use of data cleaning algorithms prior to dimensionality reduction and clustering, can lead to more objective results.
Improved linkage between various types of plots
After various analyses, all plots can be linked and manipulated on- screen, including two-dimensional plots that display cellular information as a scattergram of two parameters, spectrum plots that show raw fluorescence data for each wavelength range, dimensionality reduction plots that allow two-dimensional overview of multidimensional information, and minimal spanning tree (MST) plots that show data after clustering. This enables more efficient analysis; for example, the two-dimensional plot can be contrasted with the dimensionality-reduced plot for each cell, which would not have been possible previously.
Supporting Documents
Download SFA Security Whitepaper →
SFA Educational Videos
Introduction Watch Now →
Chapters 1–11 Watch Now →
For use in the US, Japan, France, Germany, UK, Belgium, Denmark, Sweden, Switzerland, Norway, and the Netherlands.
References
- S. V. Gassen, B. Callebaut, et al. "FlowSOM: Using self-organizing maps for visualization and interpretation of cytometry data", Cytometry Part A 87.7, 636-645, 2015.
- Quintelier, A. Couckuyt, et al. "Analyzing high-dimensional cytometry data using FlowSOM", Nature Protocols 16, 3775-3801, 2021.
- K. McInnes, J. Healy, J. Melville, “UMAP: uniform manifold approximation and projection for dimension reduction,” arXiv preprint arXiv: 1802.03426, 2018
- E. Becht, L. McInnes, et al. “Dimensionality reduction for visualizing single-cell data using UMAP,” Nat. Biotechnol. 37, 38–40, 2019.
- G. C. Linderman, M. Rachh, et al. “Fast interpolation-based t-SNE for improved visualization of single-cell RNA-seq data,” Nature Methods 16, 243-245, 2019.
- L. van der Maaten, G. Hinton, “Visualizing data using t-SNE,” J. Mach. Learn. Res. 9, 2008.